Introduction :
The graphics.h library of Turbo C++ provides a variety of functions for creating graphical user interfaces (GUIs). One of the most valuable functions in graphics.h library is pieslice(). The pieslice() function is used to draw pie slices (sector of a circle with a filled color) in the graphical program. By using pieslice(), you can create visual representations of data or statistics such as custom pie charts, progress indicators and other circular diagrams using C or C++ graphics program.
In this article, I shall show you how to use pieslice() function by C or C++ programing language. Here, I shall explore the pieslice() function in detail by which you can use it effectively in your code. After reading this article, you can use pieslice() function of graphics.h library in Turbo C++ IDE. The pieslice() function is used to draw a pie slice by C or C++ programing language, which is a sector of a circle with the desired size, angle and filled color.
The pieslice() function is used for creating different types of program. You can see my clock program, where I use pieslice() function using C or C++ graphics program. Here, I shall show you the following program using pieslice() function in C or C++ programing language.
- Creating pie chart
- Creating progress indicator
- Creating loading animation
- Creating circular gauge
- Creating radar chart
Advantages of pieslice() function :
The pieslice() function of graphics.h library has several advantages is shown below.
The pieslice() function is very easy to use for making graphics program by C or C++ programing language.
The pieslice() function gives a wide range of customization options by which you can create customized pie charts and other circular graphics. Using pieslice() function, you can specification of start and end angles, thickness, and color of the pie slice.
The pieslice() function is used for creating relatively efficient complex graphics or animations.
The pieslice() function can be used to create a variety of different types of graphics programs including pie charts, progress indicators, loading animations, circular gauges, and radar charts etc.
Disadvantages of pieslice() function :
There are some disadvantages of pieslice() function are shown below.
The pieslice() function is generally designed for creating circular graphics like pie charts. For creating more complex or irregular shapes, pieslice() function is not useful.
For use pieslice() function, you have to install Turbo C++ in your pc or download graphics.h library in your IDE.
You can not create complex loading animations and other moving graphics by pieslice() function.
The pieslice() function is a static drawing function, you cannot create interactive graphics or user input capabilities.
The pieslice() function is used for 2D graphics. You can not create 3D graphics or visualizations by pieslice() function.
The syntax of the pieslice() function :
The following syntax is use for pieslice() function in C or C++ programing language.
void pieslice(int x, int y, int start_angle, int end_angle, int radius);
The pieslice() function takes five arguments. x and y are the coordinate of the center point of the pie slice. start_angle and end_angle specify the starting and ending angles of the pie slice are measured in degrees. radius specifies the radius of the pie slice. The function fills the sector of the circle between the start_angle and end_angle with the current fill color and fill pattern.
Note that, the pieslice() function also uses the current drawing color and fill pattern, which you can set using the setcolor() and setfillstyle() functions respectively.
How to run the following program of pieslice() function in C or C++ programing language :
To run the all programs, first you have to install Turbo C++ on your pc. After install, open Turbo C++ and create a C or C++ file in Turbo C++ with .c or .cpp extension. Then, To use pieslice() function, first you need to include the graphics.h header file in your program. Then initialize the graphics mode using the initgraph() function. Now you can use all below code in your pc. You can copy my code and paste in your C or C++ file in the Turbo C++ IDE. If you do not know how to use graphics.h in turbo C++ click here.
Creating pie chart by C or C++ programing language :
The pie charts is a popular way to represent data in a circular format. You can use the pieslice() function to create a custom pie chart in your graphics program. In this program, I first initialize the graphics window using the initgraph() function. Then define the data in “value[]” array for the pie chart and set the initial angle to 0 degrees in “start_angle” variable. Here I use setbkcolor() function for set background color. After that, use a for loop to draw each slice of the pie chart using the pieslice() function.
Inside the for loop, I calculate the “end_angle” for the current slice. Now call the pieslice() function for draw slices. Finally, update the starting angle by setting it equal to the ending angle of the current slice. Here, I use delay() function for better view of the program. Once all the slices have been complete, then close the graphics mode using the closegraph() function. Now I use getch() function to wait until the user presses any key.
/*Developed by Puskar Jasu*/
#include <graphics.h>
#include <conio.h>
#include <dos.h>
int main(void)
{
    int value[] = {40, 20, 30, 10};
    int total = 100, start_angle = 0, end_angle, i;
    int graphic_driver = DETECT, graphic_mode;
    initgraph(&graphic_driver, &graphic_mode, "//turboc3/bgi");
    setbkcolor(5);
    for (i = 0; i < 4; i++)
    {
        setfillstyle(i + 1, i + 1);
        end_angle = start_angle + (360 * value[i] / total);
        pieslice(320, 240, start_angle, end_angle, 100);
        start_angle = end_angle;
        delay(800);
    }
    getch();
    closegraph();
    return 0;
}
Output :
After run this program, you can see the following output of creating pie chart by C or C++ programing language.

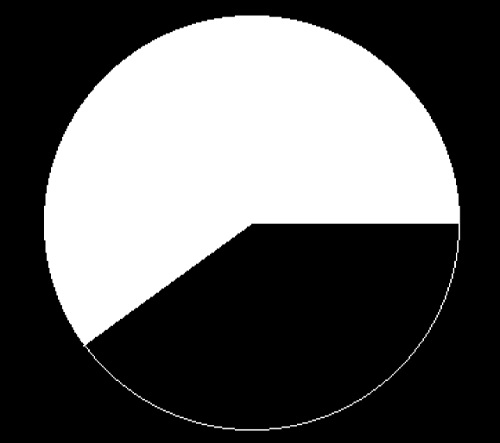
Creating progress indicator by C or C++ programing language :
Progress indicator is generally used in software applications to show the progress of a task or operation. You can use the pieslice() function to create a custom progress indicator with C or C++ programing language. In this program, I first initialize the graphics mode using the initgraph() function. Then define the progress percentage as 75% in “progress” variable and calculate the “end_angle” for the progress indicator.
Next, using setbkcolo(), setcolor() and setfillstyle() function set the background and slice color. Now you can call the pieslice() function for draw the slice. Once the pieslice is complete, the progress indicator will show a portion of the pie chart filled with color. In this program, 75% of the pie chart will be filled in, means the task or process is 75% complete. Finally, wait for press any key using the getch() function and close the graphics mode using the closegraph() function.
/*Developed by Puskar Jasu*/
#include <graphics.h>
#include <conio.h>
int main(void)
{
    int progress = 75;
    int end_angle = 360 * progress / 100;
    int graphic_driver = DETECT, graphic_mode;
    initgraph(&graphic_driver, &graphic_mode, "//turboc3/bgi");
    setbkcolor(10);
    setcolor(4);
    setfillstyle(1, 4);
    pieslice(320, 240, 0, end_angle, 100);
    getch();
    closegraph();
    return 0;
}
Output :
After run this program, you can see the following output of creating progress indicator by C or C++ programing language.

Creating a loading animation by C or C++ programing language :
A loading animation(rotating pie slice) is used to indicate that a task or operation is in progress. You can use the pieslice() function to create a custom loading animation by C or C++ programing language. Using the initgraph() function first initialize the graphics mode. Then set the starting angle to 0 degrees by “start_angle” variable and set the “increment” variable to 5.
Next, in while loop, use the pieslice() function to draw two slices of the pie chart, each with an arc angle of 120 degrees. Now update the starting angle for the next frame. After that, delay for a short time using the delay() function to control the animation speed and then clear the screen using the cleardevice() function to create the animation. Once the user presses any key using the getch() function, close the graphics mode using the closegraph() function.
/*Developed by Puskar Jasu*/
#include <graphics.h>
#include <conio.h>
#include <dos.h>
int main(void)
{
    int start_angle = 0, increment = 5, i = 0;
    int graphic_driver = DETECT, graphic_mode;
    initgraph(&graphic_driver, &graphic_mode, "//turboc3/bgi");
    while (1)
    {
        setfillstyle(1, i);
        pieslice(320, 240, start_angle, start_angle + 120, 100);
        pieslice(320, 240, start_angle + 180, start_angle + 300, 100);
        start_angle = (start_angle + increment) % 360;
        delay(10);
        i++;
        if (i > 15)
            i = 0;
        cleardevice();
        if (kbhit())
            break;
    }
    getch();
    closegraph();
    return 0;
}
Output :
After run this program, you can see the following output of creating loading animation by C or C++ programing language.

Creating a circular gauge by C or C++ programing language :
Circular gauge is used to indicate values or measurements such as the speed of a vehicle or the temperature of a room in a circular format. You can use the pieslice() function to create a custom circular gauge with C or C++ programing language. In this program, first initialize the graphics mode by initgraph() function. After that, define the maximum value of the gauge as 100 in “max” and the current value as 75 in “current” variables respectively. Now calculate the angle and store in “angle” variable.
Then call the pieslice() function with a starting angle of 0 degrees, the end angle by “angle” and a radius of 150. This will draw a slice of the pie chart that represents the current value of the gauge. Here, also draw a circle with a radius of 150 using the circle() function to complete the circular gauge. Once the gauge is complete, it will display the current value as a position on the circular arc. In this program, the gauge shows that the current value is 75 out of 100. Finally, wait for user input using the getch() function and close the graphics mode by the closegraph() function.
/*Developed by Puskar Jasu*/
#include <graphics.h>
#include <conio.h>
int main(void)
{
    int max = 100, current = 60;
    int angle = 360 * current / max;
    int graphic_driver = DETECT, graphic_mode;
    initgraph(&graphic_driver, &graphic_mode, "//turboc3/bgi");
    pieslice(320, 240, 0, angle, 150);
    circle(320, 240, 150);
    getch();
    closegraph();
    return 0;
}
Output :
After run this program, you can see the following output of creating circular gauge by C or C++ programing language.
Creating a radar chart by C or C++ programing language :
Radar chart is used to display multivariate data in circular format with multiple axes. You can use pieslice() to create a radar chart that displays data in a circular format with multiple axes by C or C++ programing language. In this program, first initialize the graphics mode using the initgraph() function. Then define the data points for the radar chart in “data[]” array. Also, take 6 int variables such as “num”, “xcen”, “ycen”, “x”, “y”, “radius” and a float variable “angle”.
Next, draw the axes of the chart using the line() function. The cos() and sin() functions use for calculating the x and y coordinates of the endpoints of the axes. Then draw the data points on the chart using the pieslice() function. Once the chart is finished, it will display the data points as slices of the pie chart on the radar chart. In this program, the chart will show six data points, with each point representing a different variable. Finally, wait for user to press any key using the getch() function and using the closegraph() function close the graphics mode.
/*Developed by Puskar Jasu*/
#include <graphics.h>
#include <conio.h>
#include <math.h>
int main(void)
{
    int data[] = {90, 80, 70, 60, 50, 40};
    int num = sizeof(data) / sizeof(data[0]);
    int xcen = 320, ycen = 240, x, y, radius = 150;
    float angle = 360 / num;
    int i = 0;
    int graphic_driver = DETECT, graphic_mode;
    initgraph(&graphic_driver, &graphic_mode, "//turboc3/bgi");
    for (i = 0; i < num; i++)
    {
        setcolor(i + 1);
        x = xcen + radius * cos(angle * i * M_PI / 180);
        y = ycen + radius * sin(angle * i * M_PI / 180);
        line(xcen, ycen, x, y);
    }
    for (i = 0; i < num; i++)
    {
        setfillstyle(1, i + 1);
        x = xcen + data[i] / 100.0 * radius * cos(angle * i * M_PI / 180);
        y = ycen + data[i] / 100.0 * radius * sin(angle * i * M_PI / 180);
        pieslice(x, y, 0, 360, 10);
    }
    getch();
    closegraph();
    return 0;
}
Output :
After run this program, you can see the following output of creating radar chart by C or C++ programing language.

Conclusion :
Overall, the pieslice() function of the graphics.h library in Turbo C++ is very useful for drawing pie slices. It can be used to create a variety of graphics and visualizations. The pieslice() function is a powerful tool for creating pie-shaped objects which show visual representations of data. Using pieslice() function, you can create a wide variety of shapes and designs from simple pie charts to complex diagrams and illustrations.
After reading this article, I think you have grain a basic idea about how to use pieslice() function of graphics.h library by C or C++ programing language. You can use all my code in your program. Thank you for visiting my site.